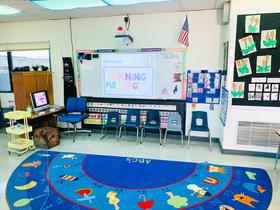
For the 2025-26 school year, there is 1 public school serving 95 students in California Academy Of Learning Charter School District.
Public School in California Academy Of Learning Charter School District have an average math proficiency score of 50% (versus the Pennsylvania public school average of 38%).
Minority enrollment is 19% of the student body (majority Black), which is less than the Pennsylvania public school average of 39% (majority Hispanic and Black).
Overview
This School District
This State (PA)
# Schools
1 School
2,928 Schools
# Students
95 Students
1,668,648 Students
# Teachers
8 Teachers
124,158 Teachers
Student-Teacher Ratio
12:1
12:1
Student By Grade
Students by Ethnicity:
Diversity Score
0.33
0.59
% American Indian
n/a
n/a
% Asian
n/a
5%
% Hispanic
1%
15%
% Black
10%
14%
% White
81%
61%
% Hawaiian
n/a
n/a
% Two or more races
8%
5%
All Ethnic Groups
Best California Academy Of Learning Charter School District Public Schools (2025-26)
School
(Math and Reading Proficiency)
(Math and Reading Proficiency)
Location
Quick Facts
Rank: n/an/a
California Academy Of Learning Charter School
Charter School
40b Trojan Way
Coal Center, PA 15423
(724) 330-4932
Coal Center, PA 15423
(724) 330-4932
Gr: K-8 | 95 students Student-teacher ratio: 12:1 Minority enrollment: 19%
Frequently Asked Questions
How many schools belong to California Academy Of Learning Charter School District?
California Academy Of Learning Charter School District manages 1 public schools serving 95 students.
What is the racial composition of students in California Academy Of Learning Charter School District?
81% of California Academy Of Learning Charter School District students are White, 10% of students are Black, 8% of students are Two or more races, and 1% of students are Hispanic.
What is the student/teacher ratio of California Academy Of Learning Charter School District?
California Academy Of Learning Charter School District has a student/teacher ratio of 12:1, which is lower than the Pennsylvania state average of 14:1.
Recent Articles

Gifted & Talented Programs in Public Schools
Explore opportunities and controversies in gifted & talented programs鈥攅quity, outcomes, and models shaping public education in 2025.

Evaluating STEM in Public Schools: A Parent & District Guide
A guide to evaluating STEM programs in public school districts鈥攎etrics, best practices, equity, and 2025 trends for parents and community stakeholders.

Special Education in Public Schools: Understanding IEPs & Services
What parents need to know about IEPs, services, rights, and how to get the best support in public schools in 2025.


