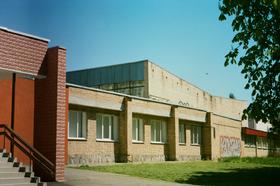
For the 2025-26 school year, there are 9 public schools serving 4,830 students in 72223, AR (there are , serving 1,608 private students). 75% of all K-12 students in 72223, AR are educated in public schools (compared to the AR state average of 94%).
The top ranked public schools in 72223, AR are Baker Elementary School, Don Roberts Elementary School and Chenal Elementary School. Overall testing rank is based on a school's combined math and reading proficiency test score ranking.
Public schools in zipcode 72223 have an average math proficiency score of 50% (versus the Arkansas public school average of 39%), and reading proficiency score of 53% (versus the 40% statewide average). Schools in 72223, AR have an average ranking of 10/10, which is in the top 10% of Arkansas public schools.
Minority enrollment is 53% of the student body (majority Black), which is more than the Arkansas public school average of 42% (majority Black).
Best 72223, AR Public Schools (2025-26)
School
(Math and Reading Proficiency)
(Math and Reading Proficiency)
Location
Quick Facts
Rank: #11.
Baker Elementary School
(Math: 75-79% | Reading: 80-84%)
Rank:
Rank:
10/
Top 1%10
15001 Kanis Rd
Little Rock, AR 72223
(501) 228-3250
Little Rock, AR 72223
(501) 228-3250
Gr: PK-5 | 392 students Student-teacher ratio: 15:1 Minority enrollment: 60%
Rank: #22.
Don Roberts Elementary School
(Math: 77% | Reading: 72%)
Rank:
Rank:
10/
Top 1%10
16601 Lamarche Dr
Little Rock, AR 72223
(501) 447-2500
Little Rock, AR 72223
(501) 447-2500
Gr: K-5 | 1,020 student Student-teacher ratio: 20:1 Minority enrollment: 42%
Rank: #33.
Chenal Elementary School
(Math: 73% | Reading: 65%)
Rank:
Rank:
10/
Top 5%10
21201 Denny Rd
Little Rock, AR 72223
(501) 490-2000
Little Rock, AR 72223
(501) 490-2000
Gr: K-5 | 420 students Student-teacher ratio: 14:1 Minority enrollment: 49%
Rank: #44.
Joe T. Robinson Middle School
(Math: 50% | Reading: 55%)
Rank:
Rank:
9/
Top 20%10
21001 Hwy 10
Little Rock, AR 72223
(501) 868-2410
Little Rock, AR 72223
(501) 868-2410
Gr: 6-8 | 543 students Student-teacher ratio: 12:1 Minority enrollment: 50%
Rank: #55.
Pinnacle View Middle School
(Math: 46% | Reading: 52%)
Rank:
Rank:
8/
Top 30%10
5701 Ranch Dr
Little Rock, AR 72223
(501) 447-8500
Little Rock, AR 72223
(501) 447-8500
Gr: 6-8 | 817 students Student-teacher ratio: 14:1 Minority enrollment: 63%
Rank: #66.
Joe T. Robinson Elem. School
(Math: 45-49% | Reading: 45-49%)
Rank:
Rank:
8/
Top 30%10
21600 Hwy 10
Little Rock, AR 72223
(501) 868-2420
Little Rock, AR 72223
(501) 868-2420
Gr: PK-5 | 305 students Student-teacher ratio: 16:1 Minority enrollment: 53%
Rank: #77.
Joe T. Robinson High School
(Math: 26% | Reading: 37%)
Rank:
Rank:
4/
Bottom 50%10
21501 Hwy 10
Little Rock, AR 72223
(501) 868-2400
Little Rock, AR 72223
(501) 868-2400
Gr: 9-12 | 845 students Student-teacher ratio: 11:1 Minority enrollment: 50%
Rank: #88.
Little Rock West High School Of Innovation
(Math: 15-19% | Reading: 30-34%)
Rank:
Rank:
3/
Bottom 50%10
5701 Ranch Drive
Little Rock, AR 72223
(501) 447-8500
Little Rock, AR 72223
(501) 447-8500
Gr: 9-12 | 270 students Student-teacher ratio: 10:1 Minority enrollment: 68%
Rank: #99.
Driven Virtual Academy
Charter School
(Math: 15-19% | Reading: 27%)
Rank:
Rank:
2/
Bottom 50%10
21001 Cantrell Road
Little Rock, AR 72223
(501) 234-3703
Little Rock, AR 72223
(501) 234-3703
Gr: K-12 | 218 students Student-teacher ratio: 10:1 Minority enrollment: 59%
72223, Arkansas Public Schools (Closed)
School
Location
Quick Facts
21001 Hwy. 10
Little Rock, AR 72223
(501) 868-2410
Little Rock, AR 72223
(501) 868-2410
Gr: 6-8 | 451 students Student-teacher ratio: 14:1 Minority enrollment: 34%
1815n Rahling Rf
Little Rock, AR 72223
(501) 821-0382
Little Rock, AR 72223
(501) 821-0382
Gr: 6-12 | 163 students Student-teacher ratio: 8:1 Minority enrollment: 50%
Frequently Asked Questions
What are the top ranked public schools in 72223, AR?
The top ranked public schools in 72223, AR include Baker Elementary School, Don Roberts Elementary School and Chenal Elementary School.
How many public schools are located in 72223?
9 public schools are located in 72223.
What percentage of students in 72223 go to public school?
75% of all K-12 students in 72223 are educated in public schools (compared to the AR state average of 94%).
What is the racial composition of students in 72223?
72223 public schools minority enrollment is 53% of the student body (majority Black), which is more than the Arkansas public schools average of 42% (majority Black).
Recent Articles

Texas Schools Enrollment Trends & Policy in 2025
Latest data and policy changes on Texas public school enrollment growth, funding, and virtual education in 2025.

Financial Aid & Hidden Costs in Public Schools
Learn about financial aid and hidden costs in public schools. Discover what parents should budget for beyond tuition-free education.

NYC Schools Still Most Segregated in 2025
Despite reforms, New York City schools remain the most segregated in the U.S. in 2025. Here鈥檚 what parents and educators need to know.
